
As we approach the end of the year, BTC and cryptocurrencies in general remain weak and it looks like this market space will end the year on the current softer note. The final BTC video for 2018, discusses the Hurst cycle relationship and how this reinforces the current bearish trend. Furthermore, a new approach is introduced that evaluates intraday data and the underlying trend condition. This method too reinforces the current bearish tone that, for now shows little sign of changing.
Taso's Tech Talk: Bitcoin
Technical Analysis Update for Bitcoin
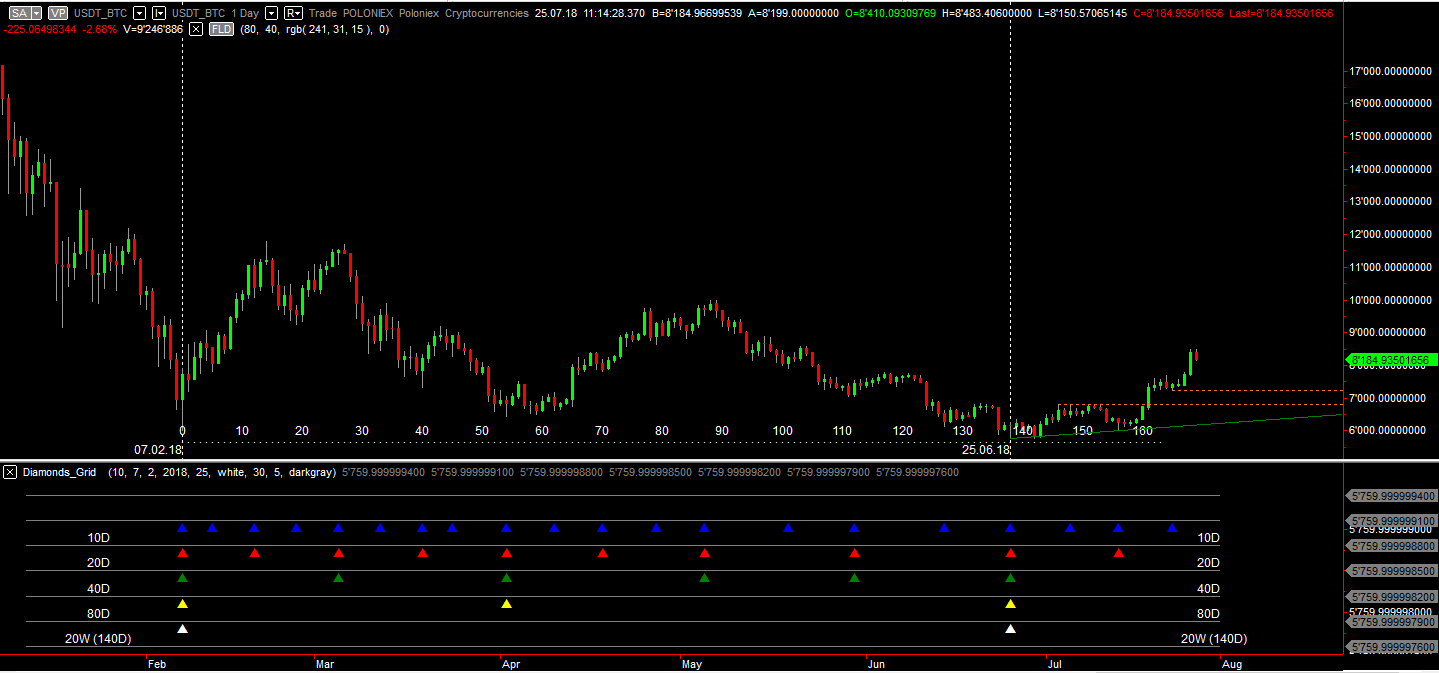
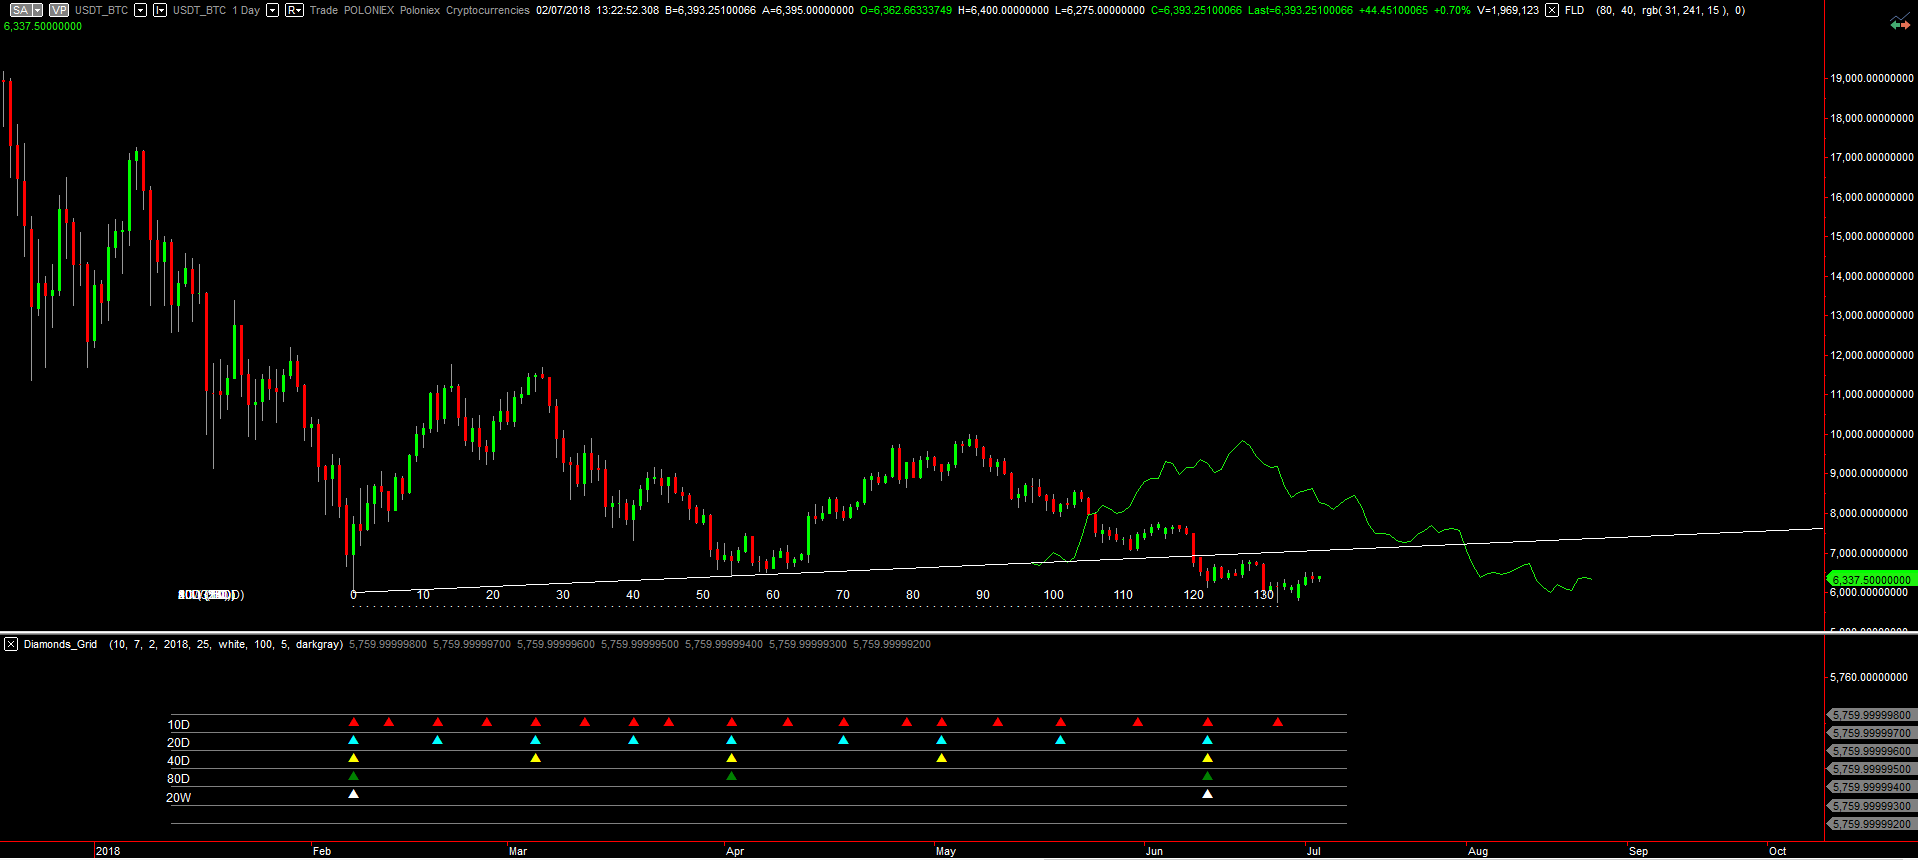
In the last BTC update, I suggested that the risk was skewed to the downside. This was clearly incorrect given strong gains seen over the course of July. Also, I had suggested that the 200D Hurst cycle phase that began off the 7-Feb low was completed on 14-Jun. Having evaluated price action since 14-Jun, a decision has been made to shift the cycle phases slightly to the right to accommodate the low on 25-Jun.
Technical Analysis Update for Bitcoin
The Hurst cycle approach was developed by J.M. Hurst and is a powerful analytical and trading tool. The premise is that markets moves in cycles of varying nominal lengths and that all these cycles are interrelated. We are thus able to analyse price action on all frequencies, from short-term to long-term, and formulate an opinion on where price action is in relation to the overall trend/cycle structure.
Technical Analysis Update for Bitcoin
From a cycle perspective BTC is seen currently trading in the final stage of the first of two 80-day cycles (55 trading days). At this latter stage of the 80-day cycle, the cycle phase is down and highlights the fact that short-term pressure on prices is likely to be bearish. This leaves the 19-Mar low of 7321 exposed and attention will be on whether the 7-Feb low of 6012.62 can remain intact. This is a key chart point and key support.
Introducing Technical Analysis

While active traders have struggled to beat the performance of someone just hodling her Bitcoins, the sharp rise in the last quarter 2017 had even old veterans question whether a more active portfolio management style wasn't perhaps appropriate.
When managing a portfolio of coins (or any other portfolio for that matter) more actively, the old saying "timing is everything" most certainly applies. We therefore thought it would be of interest for the entire community to get a professional to do the technical analysis for all of us.